Commerzbank Commodities Radar April 2020

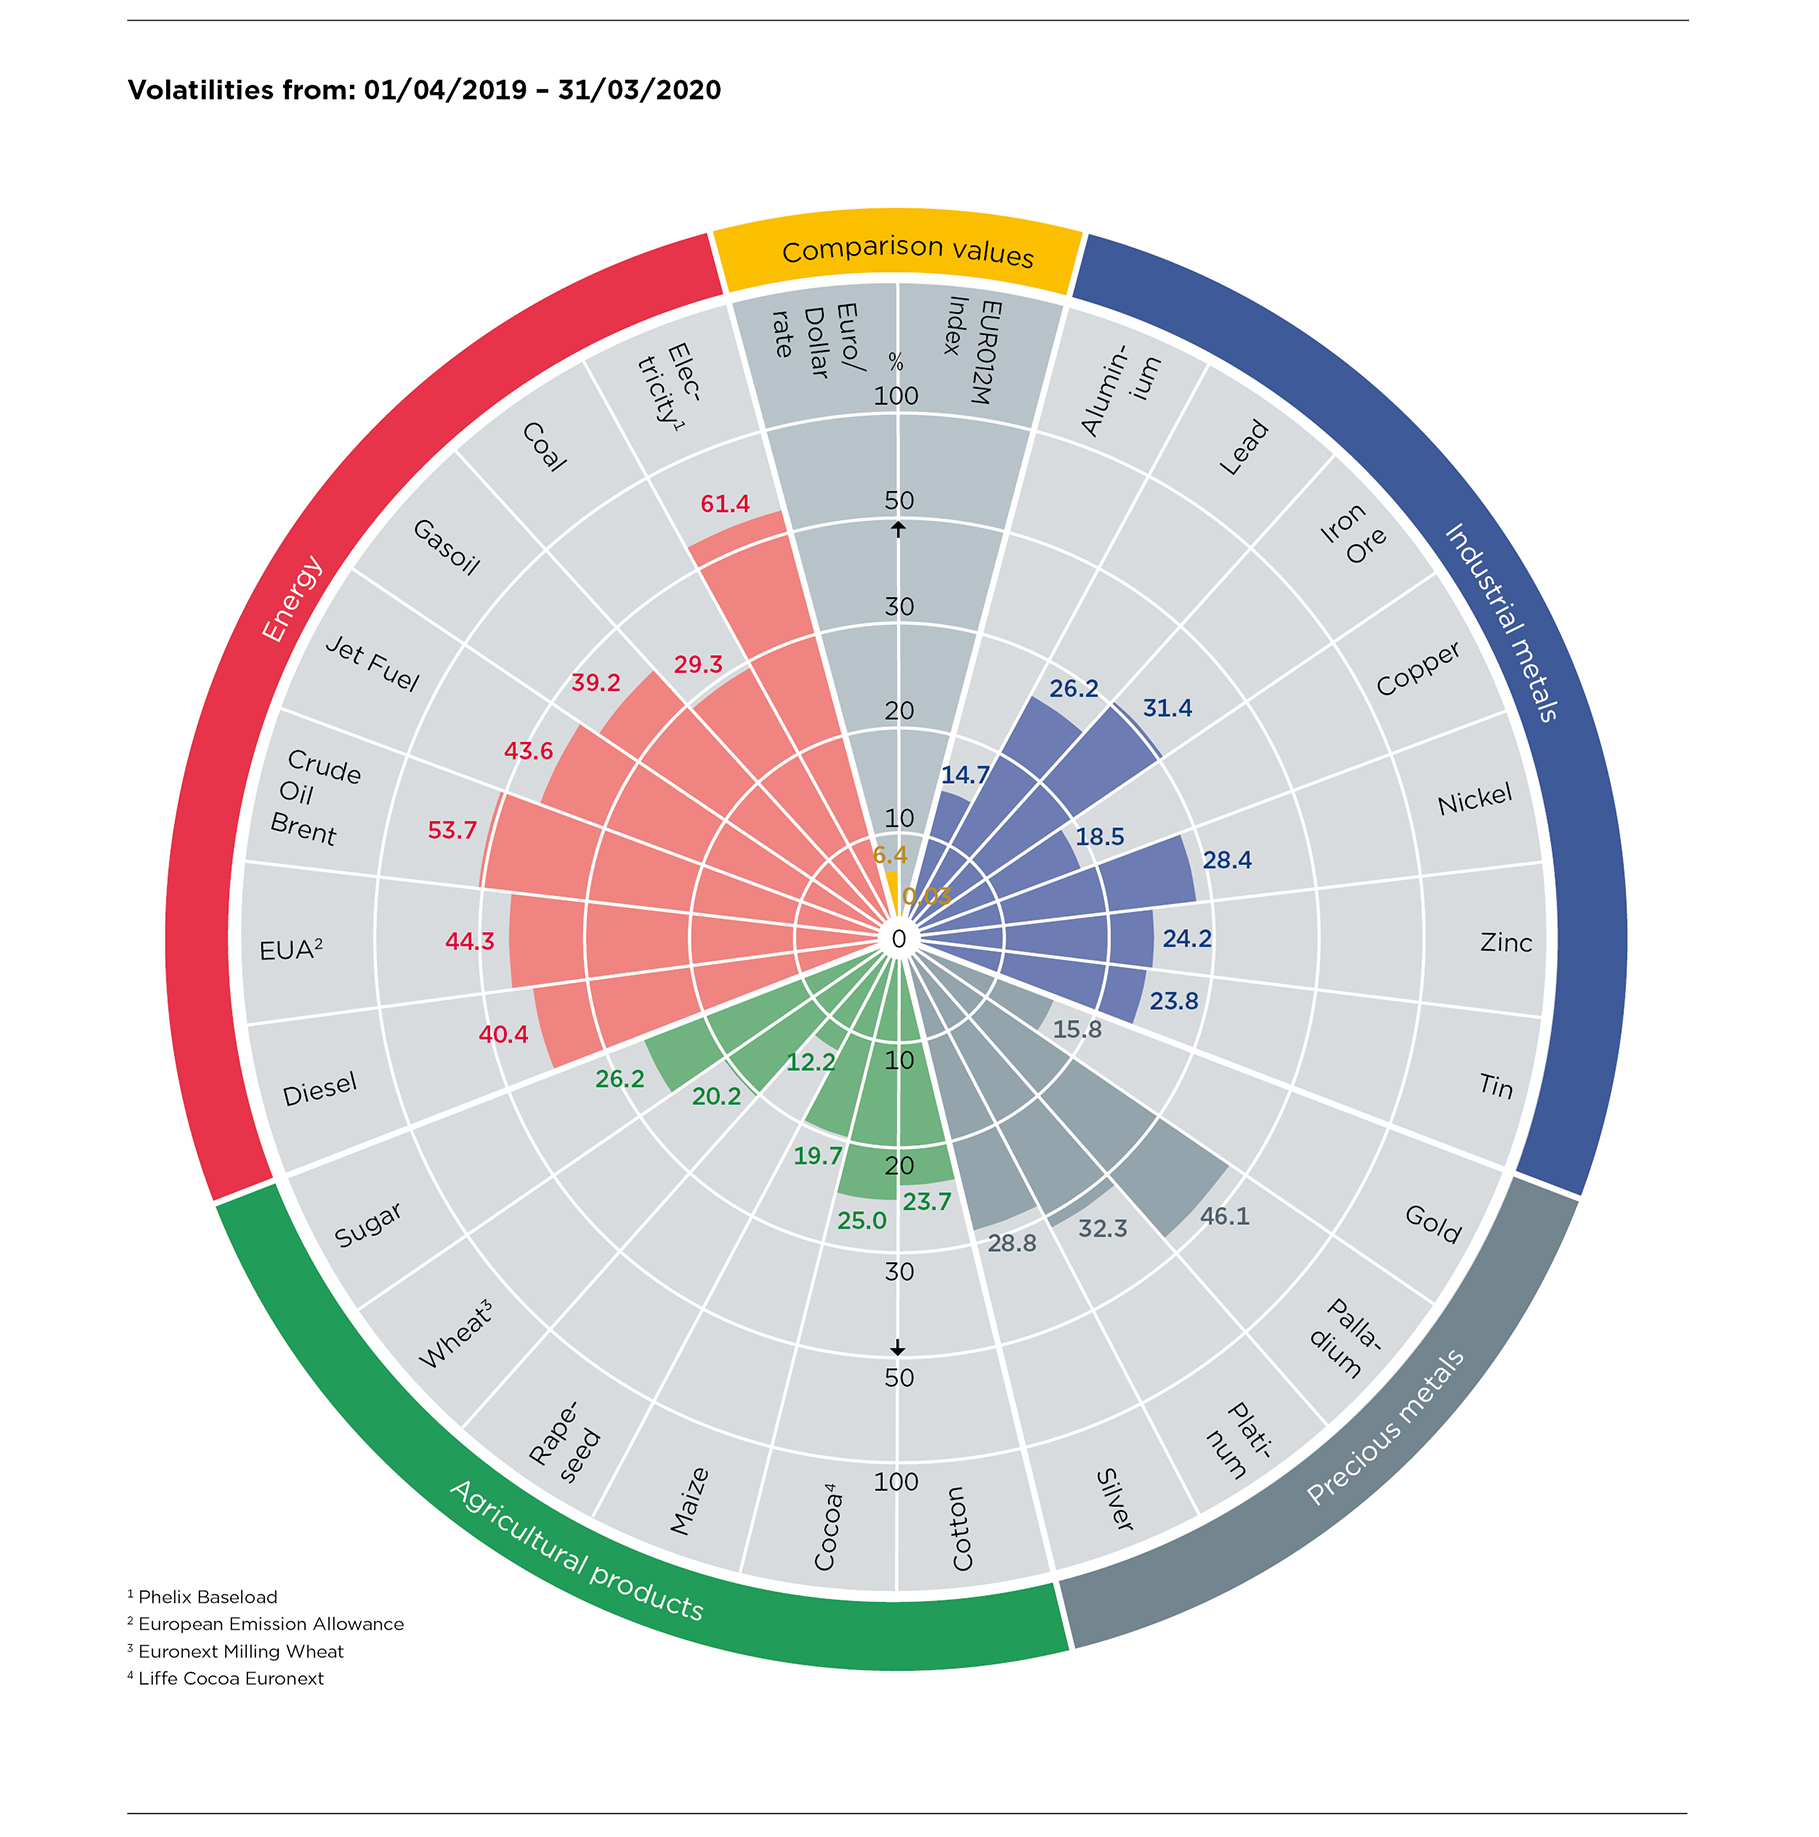
Source: Bloomberg data
Price collapse in EU emissions trading – Market Stability Reserve put to the test
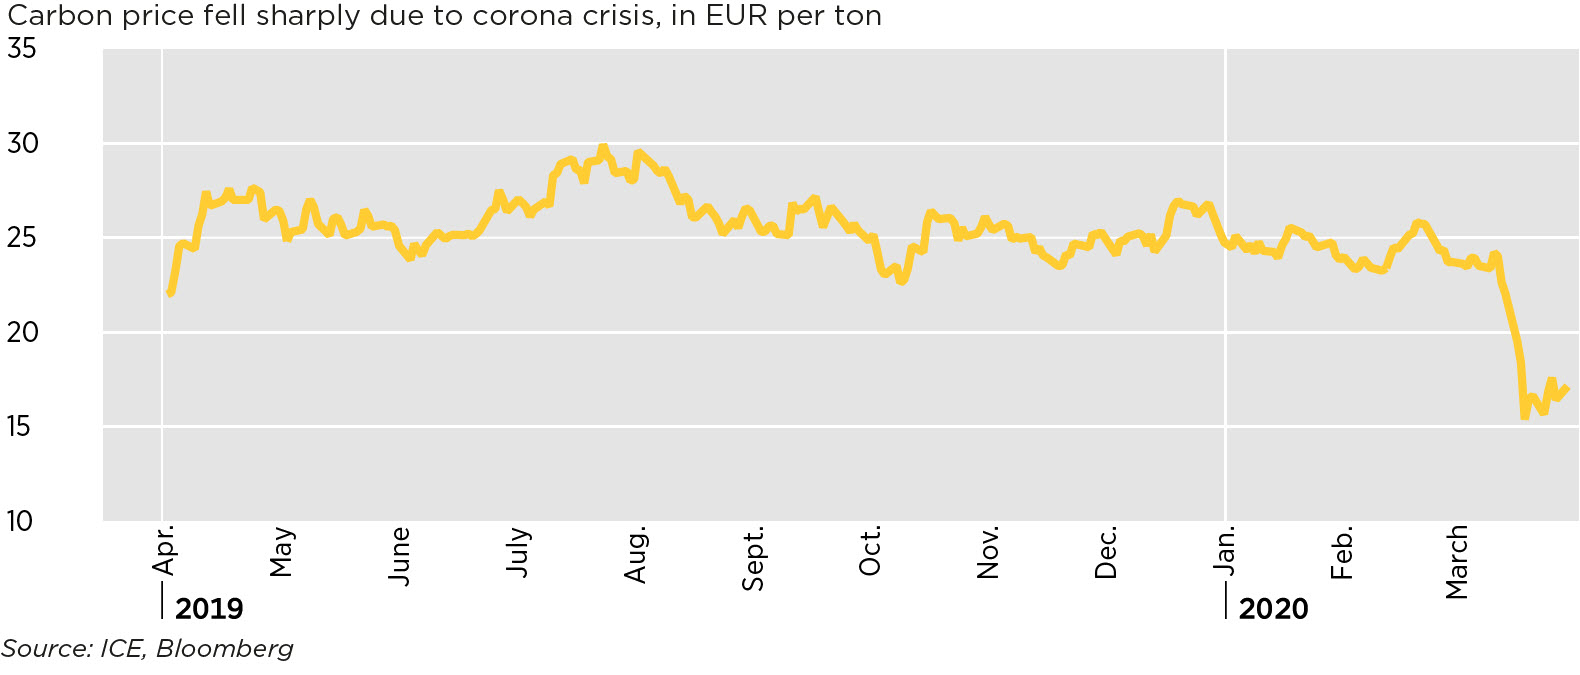
From last autumn to mid-March, the prices in the EU emissions trading system fluctuated mostly in a narrow trading range between 23 and 27 euros per ton of CO2. Late, but strongly, they were then caught in the general downward spiral of energy prices: Within one week, the allowance to emit one ton of carbon (dioxide) became 30% cheaper (chart 1). At around 15 euros, it temporarily cost as little as it did last in summer 2018.

The main reason for this was the corona-induced shut-down of the European economy, which massively lowers the need for emission allowances. As a guide: in the economic and financial crisis of 2008/2009, when GDP in the European Union fell by almost 4.5%, emissions covered by the EU ETS shrank by a good 10%. At that time, the CO2 price plummeted within a few months from just under 30 euros to under 10 euros per ton. Hardly anyone dares to quantify the extent to which the economy is suffering from the corona crisis, as there is no end in sight to the cuts. But many are expressing fears that it could become worse than twelve years ago.
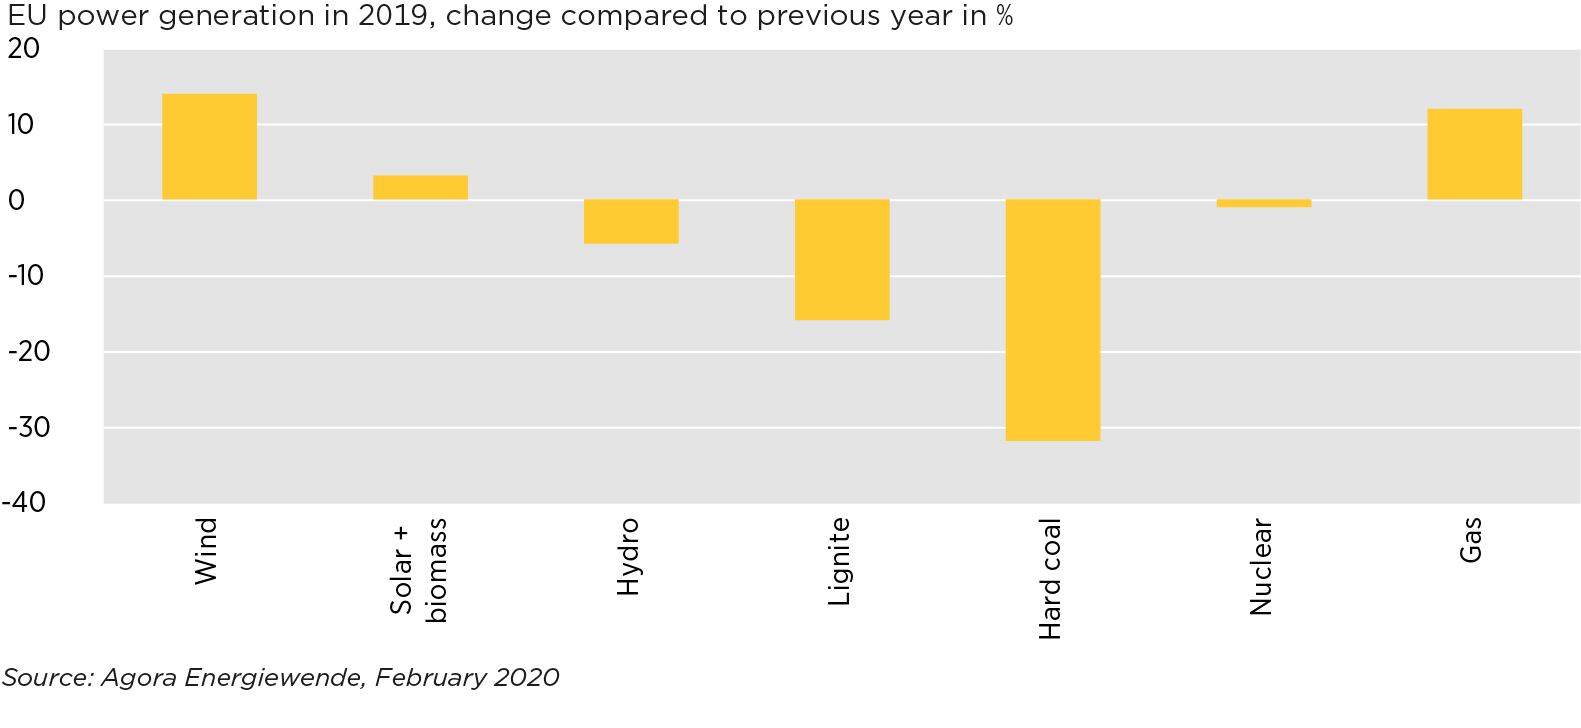
Already before the corona crisis, some burdening factors had built up. According to estimates by the Agora Energiewende expert group, emissions from all installations covered by the EU ETS already fell by almost 8% last year. This was due in particular to an estimated 12% drop in emissions from the power sector. Thanks to the advance of renewable energies and a clear fuel shift from coal-fired to gas-fired power generation, electricity production in coal-fired power plants fell massively: by 16% for lignite and 32% for hard coal (chart 2).

The demand for emission allowances is thus falling much faster than the cap of the EU ETS. In other words, the oversupply is currently rising again, which in our view certainly justifies a price correction in the short term. After all, a market was created so that prices – unlike a tax – can "breathe".
Nevertheless, we believe that the current situation differs from the situation at the end of the last decade in two main respects:
- The Market Stability Reserve (MSR), introduced at the beginning of 2019, is absorbing the surpluses that are now accumulating – albeit with some delay and only gradually. In mid-May it will be announced by how much the total number of allowances in circulation at the end of 2019 exceeded the threshold of 833 million defined by legislation. Just under a quarter of this surplus will be transferred to the MSR from September, thus reducing the future auction volumes. The same procedure will be followed for allowances that are not needed this year. Even if this automatic mechanism only gradually removes the surplus from the market, prices can recover quickly. After all, they are strongly driven by expectations: the recovery rally in EU emissions trading already began in 2017, although the MSR was not introduced until 2019 and the supply of allowances was still abundant until then.
- The political will in terms of climate protection is greater than ever. It has to be admitted that at the end of the last decade, when the economic and financial crisis eclipsed everything else for a long time, the recovery of the real economy was the goal which took precedence over everything else. In the short term, this is likely to be the case again. But in our view, climate policy ambitions are now more firmly anchored in the long term because the effects of climate change are being felt more strongly. So if prices do not recover despite the Market Stability Reserve, we believe that political adjustments would be made.
Against the background of the current and unforeseeable duration of the standstill of the European economies, we believe that a serious price correction is justified in the short term. We are therefore significantly reducing our price forecast in the near term. However, as soon as more normality returns, the automatic stabiliser "Market Stability Reserve" should come back into focus. Even if this mechanism only gradually reduces supply, prices should recover quickly rather than slowly in a strongly speculatively driven market.
Source: Commerzbank Research, as of: 01/04/2020
| in EUR per unit | in EUR per unit | ||||
| Precious metals | Agricultural products | ||||
| Gold per troy ounce |
High Low |
1,526.43 1,127.81 |
Cocoa per mt |
High Low |
2,403.27 1,781.95 |
| Palladium per troy ounce |
High Low |
2,610.38 1,158.40 |
Cotton per pound |
High Low |
0.70 0.46 |
| Platinum per troy ounce |
High Low |
933.75 553.36 |
Maize per mt |
High Low |
180.75 155.00 |
| Silver per troy ounce |
High Low |
17.77 11.04 |
Rapeseed per mt |
High Low |
421.50 355.50 |
| Sugar per pound |
High Low |
0.15 0.09 |
|||
| Wheat per mt |
High Low |
198.25 153.00 |
|||
| Industrial metals | Energy | ||||
| Aluminium per mt |
High Low |
1,674.10 1,359.12 |
Brent Crude Oil per barrel |
High Low |
66.82 20.65 |
|
Copper per mt |
High Low |
5,787.00 4,301.93 |
Coal per mt |
High Low |
56.12 40.48 |
| Iron Ore per mt |
High Low |
110.19 71.09 |
Diesel per mt |
High Low |
593.87 249.35 |
| Lead per mt |
High Low |
2,058.20 1,455.56 |
Electricity per MWh |
High Low |
43.98 17.14 |
| Nickel per mt |
High Low |
16,509.93 10,051.16 |
EUA per tonne |
High Low |
30.20 15.30 |
| Tin per mt |
High Low |
19,207.57 12,403.50 |
Gasoil per mt |
High Low |
595.20 250.05 |
| Zinc per mt |
High Low |
2,682.54 1,675.89 |
Jet Fuel per mt |
High Low |
626.30 208.69 |
* Source: Bloomberg data, period: 01/04/2019 - 31/03/2020
** From the perspective of German companies, the listed commodities are generally priced in a foreign currency. For this reason, currency risks need to be considered in addition to commodity price risks.